ROCm Tools
HCC: Heterogeneous Compute Compiler
HCC : An open source C++ compiler for heterogeneous devices
This repository hosts the HCC compiler implementation project. The goal is to implement a compiler that takes a program that conforms to a parallel programming standard such as HC, C++ 17 ParallelSTL and transforms it into the AMD GCN ISA.
Deprecation Notice
AMD is deprecating HCC to put more focus on HIP development and on other languages supporting heterogeneous compute. We will no longer develop any new feature in HCC and we will stop maintaining HCC after its final release, which is planned for June 2019. If your application was developed with the hc C++ API, we would encourage you to transition it to other languages supported by AMD, such as HIP or OpenCL. HIP and hc language share the same compiler technology, so many hc kernel language features (including inline assembly) are also available through the HIP compilation path.
The project is based on LLVM+CLANG. For more information, please visit HCC: Heterogeneous Compute Compiler
GCN Assembler and Disassembler
The Art of AMDGCN Assembly: How to Bend the Machine to Your Will
The ability to write code in assembly is essential to achieving the best performance for a GPU program. In a previous blog we described how to combine several languages in a single program using ROCm and Hsaco. This article explains how to produce Hsaco from assembly code and also takes a closer look at some new features of the GCN architecture. I’d like to thank Ilya Perminov of Luxsoft for co-authoring this blog post. Programs written for GPUs should achieve the highest performance possible. Even carefully written ones, however, won’t always employ 100% of the GPU’s capabilities. Some reasons are the following:
The program may be written in a high level language that does not expose all of the features available on the hardware.
The compiler is unable to produce optimal ISA code, either because the compiler needs to ‘play it safe’ while adhering to the semantics of a language or because the compiler itself is generating un-optimized code.
Consider a program that uses one of GCN’s new features (source code is available on GitHub). Recent hardware architecture updates—DPP and DS Permute instructions—enable efficient data sharing between wavefront lanes. To become more familiar with the instruction set, review the GCN ISA Reference Guide. Note: the assembler is currently experimental; some of syntax we describe may change.
DS Permute Instructions
Two new instructions, ds_permute_b32 and ds_bpermute_b32, allow VGPR data to move between lanes on the basis of an index from another VGPR. These instructions use LDS hardware to route data between the 64 lanes, but they don’t write to LDS memory. The difference between them is what to index: the source-lane ID or the destination-lane ID. In other words, ds_permute_b32 says “put my lane data in lane i,” and ds_bpermute_b32 says “read data from lane i.” The GCN ISA Reference Guide provides a more formal description. The test kernel is simple: read the initial data and indices from memory into GPRs, do the permutation in the GPRs and write the data back to memory. An analogous OpenCL kernel would have this form:
__kernel void hello_world(__global const uint * in, __global const uint * index, __global uint * out)
{
    size_t i = get_global_id(0);
    out[i] = in[ index[i] ];
}
Passing Parameters to a Kernel
Formal HSA arguments are passed to a kernel using a special read-only memory segment called kernarg. Before a wavefront starts, the base address of the kernarg segment is written to an SGPR pair. The memory layout of variables in kernarg must employ the same order as the list of kernel formal arguments, starting at offset 0, with no padding between variables—except to honor the requirements of natural alignment and any align qualifier. The example host program must create the kernarg segment and fill it with the buffer base addresses. The HSA host code might look like the following:
/*
* This is the host-side representation of the kernel arguments that the simplePermute kernel expects.
*/
struct simplePermute_args_t {
      uint32_t * in;
      uint32_t * index;
      uint32_t * out;
};
/*
 * Allocate the kernel-argument buffer from the correct region.
*/
hsa_status_t status;
simplePermute_args_t * args = NULL;
status = hsa_memory_allocate(kernarg_region, sizeof(simplePermute_args_t), (void**)(&args));
assert(HSA_STATUS_SUCCESS == status);
aql->kernarg_address = args;
/*
* Write the args directly to the kernargs buffer;
* the code assumes that memory is already allocated for the
* buffers that in_ptr, index_ptr and out_ptr point to
*/
args->in = in_ptr;
args->index = index_ptr;
args->out = out_ptr;
The host program should also allocate memory for the in, index and out buffers. In the GitHub repository, all the run-time-related stuff is hidden in the Dispatch and Buffer classes, so the sample code looks much cleaner:
// Create Kernarg segment
if (!AllocateKernarg(3 * sizeof(void*))) { return false; }

// Create buffers
Buffer *in, *index, *out;
in = AllocateBuffer(size);
index = AllocateBuffer(size);
out = AllocateBuffer(size);

// Fill Kernarg memory
Kernarg(in); // Add base pointer to “in” buffer
Kernarg(index); // Append base pointer to “index” buffer
Kernarg(out); // Append base pointer to “out” buffer
Initial Wavefront and Register State To launch a kernel in real hardware, the run time needs information about the kernel, such as
The LDS size
The number of GPRs
Which registers need initialization before the kernel starts
All this data resides in the amd_kernel_code_t structure. A full description of the structure is available in the AMDGPU-ABI specification. This is what it looks like in source code:
.hsa_code_object_version 2,0
.hsa_code_object_isa 8, 0, 3, "AMD", "AMDGPU"

.text
.p2align 8
.amdgpu_hsa_kernel hello_world

hello_world:

.amd_kernel_code_t
enable_sgpr_kernarg_segment_ptr = 1
is_ptr64 = 1
compute_pgm_rsrc1_vgprs = 1
compute_pgm_rsrc1_sgprs = 0
compute_pgm_rsrc2_user_sgpr = 2
kernarg_segment_byte_size = 24
wavefront_sgpr_count = 8
workitem_vgpr_count = 5
.end_amd_kernel_code_t

s_load_dwordx2  s[4:5], s[0:1], 0x10
s_load_dwordx4  s[0:3], s[0:1], 0x00
v_lshlrev_b32  v0, 2, v0
s_waitcnt     lgkmcnt(0)
v_add_u32     v1, vcc, s2, v0
v_mov_b32     v2, s3
v_addc_u32    v2, vcc, v2, 0, vcc
v_add_u32     v3, vcc, s0, v0
v_mov_b32     v4, s1
v_addc_u32    v4, vcc, v4, 0, vcc
flat_load_dword  v1, v[1:2]
flat_load_dword  v2, v[3:4]
s_waitcnt     vmcnt(0) & lgkmcnt(0)
v_lshlrev_b32  v1, 2, v1
ds_bpermute_b32  v1, v1, v2
v_add_u32     v3, vcc, s4, v0
v_mov_b32     v2, s5
v_addc_u32    v4, vcc, v2, 0, vcc
s_waitcnt     lgkmcnt(0)
flat_store_dword  v[3:4], v1
s_endpgm
Currently, a programmer must manually set all non-default values to provide the necessary information. Hopefully, this situation will change with new updates that bring automatic register counting and possibly a new syntax to fill that structure. Before the start of every wavefront execution, the GPU sets up the register state on the basis of the enable_sgpr_* and enable_vgpr_* flags. VGPR v0 is always initialized with a work-item ID in the x dimension. Registers v1 and v2 can be initialized with work-item IDs in the y and z dimensions, respectively. Scalar GPRs can be initialized with a work-group ID and work-group count in each dimension, a dispatch ID, and pointers to kernarg, the aql packet, the aql queue, and so on. Again, the AMDGPU-ABI specification contains a full list in in the section on initial register state. For this example, a 64-bit base kernarg address will be stored in the s[0:1] registers (enable_sgpr_kernarg_segment_ptr = 1), and the work-item thread ID will occupy v0 (by default). Below is the scheme showing initial state for our kernel.

The GPR Counting
The next amd_kernel_code_t fields are obvious: is_ptr64 = 1 says we are in 64-bit mode, and kernarg_segment_byte_size = 24 describes the kernarg segment size. The GPR counting is less straightforward, however. The workitem_vgpr_count holds the number of vector registers that each work item uses, and wavefront_sgpr_count holds the number of scalar registers that a wavefront uses. The code above employs v0–v4, so workitem_vgpr_count = 5. But wavefront_sgpr_count = 8 even though the code only shows s0–s5, since the special registers VCC, FLAT_SCRATCH and XNACK are physically stored as part of the wavefront’s SGPRs in the highest-numbered SGPRs. In this example, FLAT_SCRATCH and XNACK are disabled, so VCC has only two additional registers. In current GCN3 hardware, VGPRs are allocated in groups of 4 registers and SGPRs in groups of 16. Previous generations (GCN1 and GCN2) have a VGPR granularity of 4 registers and an SGPR granularity of 8 registers. The fields compute_pgm_rsrc1_*gprs contain a device-specific number for each register-block type to allocate for a wavefront. As we said previously, future updates may enable automatic counting, but for now you can use following formulas for all three GCN GPU generations:
compute_pgm_rsrc1_vgprs = (workitem_vgpr_count-1)/4

compute_pgm_rsrc1_sgprs = (wavefront_sgpr_count-1)/8
Now consider the corresponding assembly:
// initial state:
//   s[0:1] - kernarg base address
//   v0 - workitem id

s_load_dwordx2  s[4:5], s[0:1], 0x10  // load out_ptr into s[4:5] from kernarg
s_load_dwordx4  s[0:3], s[0:1], 0x00  // load in_ptr into s[0:1] and index_ptr into s[2:3] from kernarg
v_lshlrev_b32  v0, 2, v0              // v0 *= 4;
s_waitcnt     lgkmcnt(0)              // wait for memory reads to finish

// compute address of corresponding element of index buffer
// i.e. v[1:2] = &index[workitem_id]
v_add_u32     v1, vcc, s2, v0
v_mov_b32     v2, s3
v_addc_u32    v2, vcc, v2, 0, vcc

// compute address of corresponding element of in buffer
// i.e. v[3:4] = &in[workitem_id]
v_add_u32     v3, vcc, s0, v0
v_mov_b32     v4, s1
v_addc_u32    v4, vcc, v4, 0, vcc

flat_load_dword  v1, v[1:2] // load index[workitem_id] into v1
flat_load_dword  v2, v[3:4] // load in[workitem_id] into v2
s_waitcnt     vmcnt(0) & lgkmcnt(0) // wait for memory reads to finish

// v1 *= 4; ds_bpermute_b32 uses byte offset and registers are dwords
v_lshlrev_b32  v1, 2, v1

// perform permutation
// temp[thread_id] = v2
// v1 = temp[v1]
// effectively we got v1 = in[index[thread_id]]
ds_bpermute_b32  v1, v1, v2

// compute address of corresponding element of out buffer
// i.e. v[3:4] = &out[workitem_id]
v_add_u32     v3, vcc, s4, v0
v_mov_b32     v2, s5
v_addc_u32    v4, vcc, v2, 0, vcc

s_waitcnt     lgkmcnt(0) // wait for permutation to finish

// store final value in out buffer, i.e. out[workitem_id] = v1
flat_store_dword  v[3:4], v1

s_endpgm
Compiling GCN ASM Kernel Into Hsaco
The next step is to produce a Hsaco from the ASM source. LLVM has added support for the AMDGCN assembler, so you can use Clang to do all the necessary magic:
clang -x assembler -target amdgcn--amdhsa -mcpu=fiji -c -o test.o asm_source.s

clang -target amdgcn--amdhsa test.o -o test.co
The first command assembles an object file from the assembly source, and the second one links everything (you could have multiple source files) into a Hsaco. Now, you can load and run kernels from that Hsaco in a program. The GitHub examples use Cmake to automatically compile ASM sources. In a future post we will cover DPP, another GCN cross-lane feature that allows vector instructions to grab operands from a neighboring lane.
GCN Assembler Tools
Overview
This repository contains the following useful items related to AMDGPU ISA assembler:
amdphdrs: utility to convert ELF produced by llvm-mc into AMD Code Object (v1)
examples/asm-kernel: example of AMDGPU kernel code
examples/gfx8/ds_bpermute: transfer data between lanes in a wavefront with ds_bpermute_b32
examples/gfx8/dpp_reduce: calculate prefix sum in a wavefront with DPP instructions
examples/gfx8/s_memrealtime: use s_memrealtime instruction to create a delay
examples/gfx8/s_memrealtime_inline: inline assembly in OpenCL kernel version of s_memrealtime
examples/api/assemble: use LLVM API to assemble a kernel
examples/api/disassemble: use LLVM API to disassemble a stream of instructions
bin/sp3_to_mc.pl: script to convert some AMD sp3 legacy assembler syntax into LLVM MC
examples/sp3: examples of sp3 convertable code
At the time of this writing (February 2016), LLVM trunk build and latest ROCR runtime is needed.
LLVM trunk (May or later) now uses lld as linker and produces AMD Code Object (v2).
Building
Top-level CMakeLists.txt is provided to build everything included. The following CMake variables should be set:
HSA_DIR (default /opt/hsa/bin): path to ROCR Runtime
LLVM_DIR: path to LLVM build directory
To build everything, create build directory and run cmake and make:
mkdir build
cd build
cmake -DLLVM_DIR=/srv/git/llvm.git/build ..
make
Examples that require clang will only be built if clang is built as part of llvm.
Use cases
Assembling to code object with llvm-mc from command line
The following llvm-mc command line produces ELF object asm.o from assembly source asm.s:
llvm-mc -arch=amdgcn -mcpu=fiji -filetype=obj -o asm.o asm.s
Assembling to raw instruction stream with llvm-mc from command line
It is possible to extract contents of .text section after assembling to code object:
llvm-mc -arch=amdgcn -mcpu=fiji -filetype=obj -o asm.o asm.s
objdump -h asm.o | grep .text | awk '{print "dd if='asm.o' of='asm' bs=1 count=$[0x" $3 "] skip=$[0x" $6 "]"}' | bash
Disassembling code object from command line
The following command line may be used to dump contents of code object:
llvm-objdump -disassemble -mcpu=fiji asm.o
This includes text disassembly of .text section.
Disassembling raw instruction stream from command line
The following command line may be used to disassemble raw instruction stream (without ELF structure):
hexdump -v -e '/1 "0x%02X "' asm | llvm-mc -arch=amdgcn -mcpu=fiji -disassemble
Here, hexdump is used to display contents of file in hexadecimal (0x.. form) which is then consumed by llvm-mc.
Assembling source into code object using LLVM API
Refer to examples/api/assemble.
Disassembling instruction stream using LLVM API
Refer to examples/api/disassemble.
Using amdphdrs
Note that normally standard lld and Code Object version 2 should be used which is closer to standard ELF format.
amdphdrs (now obsolete) is complimentary utility that can be used to produce AMDGPU Code Object version 1. For example, given assembly source in asm.s, the following will assemble it and link using amdphdrs:
llvm-mc -arch=amdgcn -mcpu=fiji -filetype=obj -o asm.o asm.s
andphdrs asm.o asm.co
Differences between LLVM AMDGPU Assembler and AMD SP3 assembler
Macro support
SP3 supports proprietary set of macros/tools. sp3_to_mc.pl script attempts to translate them into GAS syntax understood by llvm-mc. flat_atomic_cmpswap instruction has 32-bit destination
LLVM AMDGPU:
flat_atomic_cmpswap v7, v[9:10], v[7:8]
SP3:
flat_atomic_cmpswap v[7:8], v[9:10], v[7:8]
Atomic instructions that return value should have glc flag explicitly
LLVM AMDGPU:
flat_atomic_swap_x2 v[0:1], v[0:1], v[2:3] glc
SP3:
flat_atomic_swap_x2 v[0:1], v[0:1], v[2:3]
rocprof
1. Overview
2. Profiling Modes
‘rocprof’ can be used for GPU profiling using HW counters and application tracing
2.1. GPU profiling
GPU profiling is controlled with input file which defines a list of metrics/counters and a profiling scope. An input file is provided using option ‘-i ’. Output CSV file with a line per submitted kernel is generated. Each line has kernel name, kernel parameters and counter values. By option ‘—stats’ the kernel execution stats can be generated in CSV format. Currently profiling has limitation of serializing submitted kernels. An example of input file:
# Perf counters group 1
pmc : Wavefronts VALUInsts SALUInsts SFetchInsts
# Perf counters group 2
pmc : TCC_HIT[0], TCC_MISS[0]
# Filter by dispatches range, GPU index and kernel names
# supported range formats: "3:9", "3:", "3"
range: 1 : 4
gpu: 0 1 2 3
kernel: simple Pass1 simpleConvolutionPass2
An example of profiling command line for ‘MatrixTranspose’ application
$ rocprof -i input.txt MatrixTranspose
RPL: on '191018_011134' from '/…./rocprofiler_pkg' in '/…./MatrixTranspose'
RPL: profiling '"./MatrixTranspose"'
RPL: input file 'input.txt'
RPL: output dir '/tmp/rpl_data_191018_011134_9695'
RPL: result dir '/tmp/rpl_data_191018_011134_9695/input0_results_191018_011134'
ROCProfiler: rc-file '/…./rpl_rc.xml'
ROCProfiler: input from "/tmp/rpl_data_191018_011134_9695/input0.xml"
  gpu_index =
  kernel =
  range =
  4 metrics
    L2CacheHit, VFetchInsts, VWriteInsts, MemUnitStalled
  0 traces
Device name Ellesmere [Radeon RX 470/480/570/570X/580/580X]
PASSED!

ROCPRofiler: 1 contexts collected, output directory /tmp/rpl_data_191018_011134_9695/input0_results_191018_011134
RPL: '/…./MatrixTranspose/input.csv' is generated
2.1.1. Counters and metrics
There are two profiling features, metrics and traces. Hardware performance counters are treated as the basic metrics and the formulas can be defined for derived metrics. Counters and metrics can be dynamically configured using XML configuration files with counters and metrics tables:
Counters table entry, basic metric: counter name, block name, event id
Derived metrics table entry: metric name, an expression for calculation the metric from the counters
Metrics XML File Example:
<gfx8>
    <metric name=L1_CYCLES_COUNTER block=L1 event=0 descr=”L1 cache cycles”></metric>
    <metric name=L1_MISS_COUNTER block=L1 event=33 descr=”L1 cache misses”></metric>
    . . .
</gfx8>

<gfx9>
    . . .
</gfx9>

<global>
  <metric
    name=L1_MISS_RATIO
    expr=L1_CYCLES_COUNT/L1_MISS_COUNTER
    descry=”L1 miss rate metric”
  ></metric>
</global>
2.1.1.1. Metrics query
Available counters and metrics can be queried by options ‘—list-basic’ for counters and ‘—list-derived’ for derived metrics. The output for counters indicates number of block instances and number of block counter registers. The output for derived metrics prints the metrics expressions. Examples:
$ rocprof --list-basic
RPL: on '191018_014450' from '/opt/rocm/rocprofiler' in '/…./MatrixTranspose'
ROCProfiler: rc-file '/…./rpl_rc.xml'
Basic HW counters:
  gpu-agent0 : GRBM_COUNT : Tie High - Count Number of Clocks
      block GRBM has 2 counters
  gpu-agent0 : GRBM_GUI_ACTIVE : The GUI is Active
      block GRBM has 2 counters
      . . .
  gpu-agent0 : TCC_HIT[0-15] : Number of cache hits.
      block TCC has 4 counters
  gpu-agent0 : TCC_MISS[0-15] : Number of cache misses. UC reads count as misses.
      block TCC has 4 counters
      . . .

$ rocprof --list-derived
RPL: on '191018_015911' from '/opt/rocm/rocprofiler' in '/home/evgeny/work/BUILD/0_MatrixTranspose'
ROCProfiler: rc-file '/home/evgeny/rpl_rc.xml'
Derived metrics:
  gpu-agent0 : TCC_HIT_sum : Number of cache hits. Sum over TCC instances.
      TCC_HIT_sum = sum(TCC_HIT,16)
  gpu-agent0 : TCC_MISS_sum : Number of cache misses. Sum over TCC instances.
      TCC_MISS_sum = sum(TCC_MISS,16)
  gpu-agent0 : TCC_MC_RDREQ_sum : Number of 32-byte reads. Sum over TCC instaces.
      TCC_MC_RDREQ_sum = sum(TCC_MC_RDREQ,16)
    . . .
2.1.1.2. Metrics collecting
Counters and metrics accumulated per kernel can be collected using input file with a list of metrics, see an example in 2.1. Currently profiling has limitation of serializing submitted kernels. The number of counters which can be dumped by one run is limited by GPU HW by number of counter registers per block. The number of counters can be different for different blocks and can be queried, see 2.1.1.1.
2.1.1.2.1. Blocks instancing
GPU blocks are implemented as several identical instances. To dump counters of specific instance square brackets can be used, see an example in 2.1. The number of block instances can be queried, see 2.1.1.1.
2.1.1.2.2. HW limitations
The number of counters which can be dumped by one run is limited by GPU HW by number of counter registers per block. The number of counters can be different for different blocks and can be queried, see 2.1.1.1.
Metrics groups
To dump a list of metrics exceeding HW limitations the metrics list can be split on groups. The tool supports automatic splitting on optimal metric groups:
$ rocprof -i input.txt ./MatrixTranspose
RPL: on '191018_032645' from '/opt/rocm/rocprofiler' in '/…./MatrixTranspose'
RPL: profiling './MatrixTranspose'
RPL: input file 'input.txt'
RPL: output dir '/tmp/rpl_data_191018_032645_12106'
RPL: result dir '/tmp/rpl_data_191018_032645_12106/input0_results_191018_032645'
ROCProfiler: rc-file '/…./rpl_rc.xml'
ROCProfiler: input from "/tmp/rpl_data_191018_032645_12106/input0.xml"
  gpu_index =
  kernel =
  range =
  20 metrics
    Wavefronts, VALUInsts, SALUInsts, SFetchInsts, FlatVMemInsts, LDSInsts, FlatLDSInsts, GDSInsts, VALUUtilization, FetchSize, WriteSize, L2CacheHit, VWriteInsts, GPUBusy, VALUBusy, SALUBusy, MemUnitStalled, WriteUnitStalled, LDSBankConflict, MemUnitBusy
  0 traces
Device name Ellesmere [Radeon RX 470/480/570/570X/580/580X]

Input metrics out of HW limit. Proposed metrics group set:
 group1: L2CacheHit VWriteInsts MemUnitStalled WriteUnitStalled MemUnitBusy FetchSize FlatVMemInsts LDSInsts VALUInsts SALUInsts SFetchInsts FlatLDSInsts GPUBusy Wavefronts
 group2: WriteSize GDSInsts VALUUtilization VALUBusy SALUBusy LDSBankConflict

ERROR: rocprofiler_open(), Construct(), Metrics list exceeds HW limits

Aborted (core dumped)
Error found, profiling aborted.
Collecting with multiple runs
To collect several metric groups a full application replay is used by defining several ‘pmc:’ lines in the input file, see 2.1.
2.2. Application tracing
Supported application tracing includes runtime API and GPU activity tracing’ Supported runtimes are: ROCr (HSA API) and HIP Supported GPU activity: kernel execution, async memory copy, barrier packets. The trace is generated in JSON format compatible with Chrome tracing. The trace consists of several sections with timelines for API trace per thread and GPU activity. The timelines events show event name and parameters. Supported options: ‘—hsa-trace’, ‘—hip-trace’, ‘—sys-trace’, where ‘sys trace’ is for HIP and HSA combined trace.
2.2.1. HIP runtime trace
The trace is generated by option ‘—hip-trace’ and includes HIP API timelines and GPU activity at the runtime level.
2.2.2. ROCr runtime trace
The trace is generated by option ‘—hsa-trace’ and includes ROCr API timelines and GPU activity at AQL queue level. Also, can provide counters per kernel.
2.2.3. KFD driver trace
Is planned to include Thunk API trace and memory allocations/migration tracing.
2.2.4. Code annotation
Support for application code annotation. Start/stop API is supported to programmatically control the profiling. A ‘roctx’ library provides annotation API. Annotation is visualized in JSON trace as a separate “Markers and Ranges” timeline section.
2.2.4.1. Start/stop API
// Tracing start API
void roctracer_start();

// Tracing stop API
void roctracer_stop();
2.2.4.2. rocTX basic markers API
// A marker created by given ASCII message
void roctxMark(const char* message);

// Returns the 0 based level of a nested range being started by given message associated to this range.
// A negative value is returned on the error.
int roctxRangePush(const char* message);

// Marks the end of a nested range.
// Returns the 0 based level the range.
// A negative value is returned on the error.
int roctxRangePop();
2.3. Multiple GPUs profiling
The profiler supports multiple GPU’s profiling and provide GPI id for counters and kernels data in CSV output file. Also, GPU id is indicating for respective GPU activity timeline in JSON trace.
3. Profiling control
Profiling can be controlled by specifying a profiling scope, by filtering trace events and specifying interesting time intervals.
3.1. Profiling scope
Counters profiling scope can be specified by GPU id list, kernel name substrings list and dispatch range. Supported range formats examples: “3:9”, “3:”, “3”. You can see an example of input file in 2.1.
3.2. Tracing control
Tracing can be filtered by events names using profiler input file and by enabling interesting time intervals by command line option.
3.2.1. Filtering traced APIs
A list of traced API names can be specified in profiler input file. An example of input file line for ROCr runtime trace (HAS API): hsa: hsa_queue_create hsa_amd_memory_pool_allocate
3.2.2. Tracing time period
Trace can be dumped periodically with initial delay, dumping period length and rate:
--trace-period <dealy:length:rate>
3.3. Concurrent kernels
Currently concurrent kernels profiling is not supported which is a planned feature. Kernels are serialized.
3.4. Multi-processes profiling
Multi-processes profiling is not currently supported.
3.5. Errors logging
Profiler errors are logged to global logs:
/tmp/aql_profile_log.txt
/tmp/rocprofiler_log.txt
/tmp/roctracer_log.txt
4. 3rd party visualization tools
‘rocprof’ is producing JSON trace compatible with Chrome Tracing, which is an internal trace visualization tool in Google Chrome.
4.1. Chrome tracing
Good review can be found by the link: https://aras-p.info/blog/2017/01/23/Chrome-Tracing-as-Profiler-Frontend/
5. Command line options
The command line options can be printed with option ‘-h’:
$ rocprof -h
RPL: on '191018_023018' from '/opt/rocm/rocprofiler' in '/…./MatrixTranspose'
ROCm Profiling Library (RPL) run script, a part of ROCprofiler library package.
Full path: /opt/rocm/rocprofiler/bin/rocprof
Metrics definition: /opt/rocm/rocprofiler/lib/metrics.xml

Usage:
  rocprof [-h] [--list-basic] [--list-derived] [-i <input .txt/.xml file>] [-o <output CSV file>] <app command line>

Options:
  -h - this help
  --verbose - verbose mode, dumping all base counters used in the input metrics
  --list-basic - to print the list of basic HW counters
  --list-derived - to print the list of derived metrics with formulas

  -i <.txt|.xml file> - input file
      Input file .txt format, automatically rerun application for every pmc line:

        # Perf counters group 1
        pmc : Wavefronts VALUInsts SALUInsts SFetchInsts FlatVMemInsts LDSInsts FlatLDSInsts GDSInsts VALUUtilization FetchSize
        # Perf counters group 2
        pmc : WriteSize L2CacheHit
        # Filter by dispatches range, GPU index and kernel names
        # supported range formats: "3:9", "3:", "3"
        range: 1 : 4
        gpu: 0 1 2 3
        kernel: simple Pass1 simpleConvolutionPass2

      Input file .xml format, for single profiling run:

        # Metrics list definition, also the form "<block-name>:<event-id>" can be used
        # All defined metrics can be found in the 'metrics.xml'
        # There are basic metrics for raw HW counters and high-level metrics for derived counters
        <metric name=SQ:4,SQ_WAVES,VFetchInsts
        ></metric>

        # Filter by dispatches range, GPU index and kernel names
        <metric
          # range formats: "3:9", "3:", "3"
          range=""
          # list of gpu indexes "0,1,2,3"
          gpu_index=""
          # list of matched sub-strings "Simple1,Conv1,SimpleConvolution"
          kernel=""
        ></metric>

  -o <output file> - output CSV file [<input file base>.csv]
  -d <data directory> - directory where profiler store profiling data including traces [/tmp]
      The data directory is renoving autonatically if the directory is matching the temporary one, which is the default.
  -t <temporary directory> - to change the temporary directory [/tmp]
      By changing the temporary directory you can prevent removing the profiling data from /tmp or enable removing from not '/tmp' directory.

  --basenames <on|off> - to turn on/off truncating of the kernel full function names till the base ones [off]
  --timestamp <on|off> - to turn on/off the kernel disoatches timestamps, dispatch/begin/end/complete [off]
  --ctx-wait <on|off> - to wait for outstanding contexts on profiler exit [on]
  --ctx-limit <max number> - maximum number of outstanding contexts [0 - unlimited]
  --heartbeat <rate sec> - to print progress heartbeats [0 - disabled]

  --stats - generating kernel execution stats, file <output name>.stats.csv
  --hsa-trace - to trace HSA, generates API execution stats and JSON file chrome-tracing compatible
  --hip-trace - to trace HIP, generates API execution stats and JSON file chrome-tracing compatible
  --sys-trace - to trace HIP/HSA APIs and GPU activity, generates stats and JSON trace chrome-tracing compatible
    Generated files: <output name>.hsa_stats.txt <output name>.json
    Traced API list can be set by input .txt or .xml files.
    Input .txt:
      hsa: hsa_queue_create hsa_amd_memory_pool_allocate
    Input .xml:
      <trace name="HSA">
        <parameters list="hsa_queue_create, hsa_amd_memory_pool_allocate">
        </parameters>
      </trace>

  --trace-period <dealy:length:rate> - to enable trace with initial delay, with periodic sample length and rate
    Supported time formats: <number(m|s|ms|us)>

Configuration file:
  You can set your parameters defaults preferences in the configuration file 'rpl_rc.xml'. The search path sequence: .:/home/evgeny:<package path>
  First the configuration file is looking in the current directory, then in your home, and then in the package directory.
  Configurable options: 'basenames', 'timestamp', 'ctx-limit', 'heartbeat'.
  An example of 'rpl_rc.xml':
    <defaults
      basenames=off
      timestamp=off
      ctx-limit=0
      heartbeat=0
    ></defaults>
6. Publicly available counters and metrics
The following counters are publicly available for commercially available VEGA10/20 GPUs.
Counters:
•   GRBM_COUNT : Tie High - Count Number of Clocks
•   GRBM_GUI_ACTIVE : The GUI is Active
•   SQ_WAVES : Count number of waves sent to SQs. (per-simd, emulated, global)
•   SQ_INSTS_VALU : Number of VALU instructions issued. (per-simd, emulated)
•   SQ_INSTS_VMEM_WR : Number of VMEM write instructions issued (including FLAT). (per-simd, emulated)
•   SQ_INSTS_VMEM_RD : Number of VMEM read instructions issued (including FLAT). (per-simd, emulated)
•   SQ_INSTS_SALU : Number of SALU instructions issued. (per-simd, emulated)
•   SQ_INSTS_SMEM : Number of SMEM instructions issued. (per-simd, emulated)
•   SQ_INSTS_FLAT : Number of FLAT instructions issued. (per-simd, emulated)
•   SQ_INSTS_FLAT_LDS_ONLY : Number of FLAT instructions issued that read/wrote only from/to LDS (only works if EARLY_TA_DONE is enabled). (per-simd, emulated)
•   SQ_INSTS_LDS : Number of LDS instructions issued (including FLAT). (per-simd, emulated)
•   SQ_INSTS_GDS : Number of GDS instructions issued. (per-simd, emulated)
•   SQ_WAIT_INST_LDS : Number of wave-cycles spent waiting for LDS instruction issue. In units of 4 cycles. (per-simd, nondeterministic)
•   SQ_ACTIVE_INST_VALU : regspec 71? Number of cycles the SQ instruction arbiter is working on a VALU instruction. (per-simd, nondeterministic)
•   SQ_INST_CYCLES_SALU : Number of cycles needed to execute non-memory read scalar operations. (per-simd, emulated)
•   SQ_THREAD_CYCLES_VALU : Number of thread-cycles used to execute VALU operations (similar to INST_CYCLES_VALU but multiplied by # of active threads). (per-simd)
•   SQ_LDS_BANK_CONFLICT : Number of cycles LDS is stalled by bank conflicts. (emulated)
•   TA_TA_BUSY[0-15] : TA block is busy. Perf_Windowing not supported for this counter.
•   TA_FLAT_READ_WAVEFRONTS[0-15] : Number of flat opcode reads processed by the TA.
•   TA_FLAT_WRITE_WAVEFRONTS[0-15] : Number of flat opcode writes processed by the TA.
•   TCC_HIT[0-15] : Number of cache hits.
•   TCC_MISS[0-15] : Number of cache misses. UC reads count as misses.
•   TCC_EA_WRREQ[0-15] : Number of transactions (either 32-byte or 64-byte) going over the TC_EA_wrreq interface. Atomics may travel over the same interface and are generally classified as write requests. This does not include probe commands.
•   TCC_EA_WRREQ_64B[0-15] : Number of 64-byte transactions going (64-byte write or CMPSWAP) over the TC_EA_wrreq interface.
•   TCC_EA_WRREQ_STALL[0-15] : Number of cycles a write request was stalled.
•   TCC_EA_RDREQ[0-15] : Number of TCC/EA read requests (either 32-byte or 64-byte)
•   TCC_EA_RDREQ_32B[0-15] : Number of 32-byte TCC/EA read requests
•   TCP_TCP_TA_DATA_STALL_CYCLES[0-15] : TCP stalls TA data interface. Now Windowed.
The following derived metrics have been defined and the profiler metrics XML specification can be found at: https://github.com/ROCm-Developer-Tools/rocprofiler/blob/amd-master/test/tool/metrics.xml.
Metrics:
•   TA_BUSY_avr : TA block is busy. Average over TA instances.
•   TA_BUSY_max : TA block is busy. Max over TA instances.
•   TA_BUSY_min : TA block is busy. Min over TA instances.
•   TA_FLAT_READ_WAVEFRONTS_sum : Number of flat opcode reads processed by the TA. Sum over TA instances.
•   TA_FLAT_WRITE_WAVEFRONTS_sum : Number of flat opcode writes processed by the TA. Sum over TA instances.
•   TCC_HIT_sum : Number of cache hits. Sum over TCC instances.
•   TCC_MISS_sum : Number of cache misses. Sum over TCC instances.
•   TCC_EA_RDREQ_32B_sum : Number of 32-byte TCC/EA read requests. Sum over TCC instances.
•   TCC_EA_RDREQ_sum : Number of TCC/EA read requests (either 32-byte or 64-byte). Sum over TCC instances.
•   TCC_EA_WRREQ_sum : Number of transactions (either 32-byte or 64-byte) going over the TC_EA_wrreq interface. Sum over TCC instances.
•   TCC_EA_WRREQ_64B_sum : Number of 64-byte transactions going (64-byte write or CMPSWAP) over the TC_EA_wrreq interface. Sum over TCC instances.
•   TCC_WRREQ_STALL_max : Number of cycles a write request was stalled. Max over TCC instances.
•   TCC_MC_WRREQ_sum : Number of 32-byte effective writes. Sum over TCC instaces.
•   FETCH_SIZE : The total kilobytes fetched from the video memory. This is measured with all extra fetches and any cache or memory effects taken into account.
•   WRITE_SIZE : The total kilobytes written to the video memory. This is measured with all extra fetches and any cache or memory effects taken into account.
•   GPUBusy : The percentage of time GPU was busy.
•   Wavefronts : Total wavefronts.
•   VALUInsts : The average number of vector ALU instructions executed per work-item (affected by flow control).
•   SALUInsts : The average number of scalar ALU instructions executed per work-item (affected by flow control).
•   VFetchInsts : The average number of vector fetch instructions from the video memory executed per work-item (affected by flow control). Excludes FLAT instructions that fetch from video memory.
•   SFetchInsts : The average number of scalar fetch instructions from the video memory executed per work-item (affected by flow control).
•   VWriteInsts : The average number of vector write instructions to the video memory executed per work-item (affected by flow control). Excludes FLAT instructions that write to video memory.
•   FlatVMemInsts : The average number of FLAT instructions that read from or write to the video memory executed per work item (affected by flow control). Includes FLAT instructions that read from or write to scratch.
•   LDSInsts : The average number of LDS read or LDS write instructions executed per work item (affected by flow control).  Excludes FLAT instructions that read from or write to LDS.
•   FlatLDSInsts : The average number of FLAT instructions that read or write to LDS executed per work item (affected by flow control).
•   GDSInsts : The average number of GDS read or GDS write instructions executed per work item (affected by flow control).
•   VALUUtilization : The percentage of active vector ALU threads in a wave. A lower number can mean either more thread divergence in a wave or that the work-group size is not a multiple of 64. Value range: 0% (bad), 100% (ideal - no thread divergence).
•   VALUBusy : The percentage of GPUTime vector ALU instructions are processed. Value range: 0% (bad) to 100% (optimal).
•   SALUBusy : The percentage of GPUTime scalar ALU instructions are processed. Value range: 0% (bad) to 100% (optimal).
•   Mem32Bwrites :
•   FetchSize : The total kilobytes fetched from the video memory. This is measured with all extra fetches and any cache or memory effects taken into account.
•   WriteSize : The total kilobytes written to the video memory. This is measured with all extra fetches and any cache or memory effects taken into account.
•   L2CacheHit : The percentage of fetch, write, atomic, and other instructions that hit the data in L2 cache. Value range: 0% (no hit) to 100% (optimal).
•   MemUnitBusy : The percentage of GPUTime the memory unit is active. The result includes the stall time (MemUnitStalled). This is measured with all extra fetches and writes and any cache or memory effects taken into account. Value range: 0% to 100% (fetch-bound).
•   MemUnitStalled : The percentage of GPUTime the memory unit is stalled. Try reducing the number or size of fetches and writes if possible. Value range: 0% (optimal) to 100% (bad).
•   WriteUnitStalled : The percentage of GPUTime the Write unit is stalled. Value range: 0% to 100% (bad).
•   ALUStalledByLDS : The percentage of GPUTime ALU units are stalled by the LDS input queue being full or the output queue being not ready. If there are LDS bank conflicts, reduce them. Otherwise, try reducing the number of LDS accesses if possible. Value range: 0% (optimal) to 100% (bad).
•   LDSBankConflict : The percentage of GPUTime LDS is stalled by bank conflicts. Value range: 0% (optimal) to 100% (bad).
ROC Profiler
ROC profiler library. Profiling with perf-counters and derived metrics. Library supports GFX8/GFX9.
HW specific low-level performance analysis interface for profiling of GPU compute applications. The profiling includes HW performance counters with complex performance metrics.
Metrics
The link to profiler default metrics XML specification.
Download
To clone ROC Profiler from GitHub use the folowing command:
git clone https://github.com/ROCm-Developer-Tools/rocprofiler
The library source tree:
- bin
rocprof - Profiling tool run script
doc - Documentation
inc/rocprofiler.h - Library public API
- src - Library sources
core - Library API sources
util - Library utils sources
xml - XML parser
- test - Library test suite
- tool - Profiling tool
tool.cpp - tool sources
metrics.xml - metrics config file
ctrl - Test controll
util - Test utils
simple_convolution - Simple convolution test kernel
Build
Build environment:
export CMAKE_PREFIX_PATH=<path to hsa-runtime includes>:<path to hsa-runtime library>
export CMAKE_BUILD_TYPE=<debug|release> # release by default
export CMAKE_DEBUG_TRACE=1 # to enable debug tracing
To Build with the current installed ROCm:
To build and install to /opt/rocm/rocprofiler
export CMAKE_PREFIX_PATH=/opt/rocm/include/hsa:/opt/rocm
cd ../rocprofiler
mkdir build
cd build
cmake ..
make
make install
Internal ‘simple_convolution’ test run script:
cd ../rocprofiler/build
./run.sh
To enable error messages logging to ‘/tmp/rocprofiler_log.txt’:
export ROCPROFILER_LOG=1
To enable verbose tracing:
export ROCPROFILER_TRACE=1
Profiling utility usage
rocprof [-h] [--list-basic] [--list-derived] [-i <input .txt/.xml file>] [-o <output CSV file>] <app command line>

Options:
-h - this help
--verbose - verbose mode, dumping all base counters used in the input metrics
--list-basic - to print the list of basic HW counters
--list-derived - to print the list of derived metrics with formulas

-i <.txt|.xml file> - input file
    Input file .txt format, automatically rerun application for every pmc line:

      # Perf counters group 1
      pmc : Wavefronts VALUInsts SALUInsts SFetchInsts FlatVMemInsts LDSInsts FlatLDSInsts GDSInsts FetchSize
      # Perf counters group 2
      pmc : VALUUtilization,WriteSize L2CacheHit
      # Filter by dispatches range, GPU index and kernel names
      # supported range formats: "3:9", "3:", "3"
      range: 1 : 4
      gpu: 0 1 2 3
      kernel: simple Pass1 simpleConvolutionPass2

    Input file .xml format, for single profiling run:

      # Metrics list definition, also the form "<block-name>:<event-id>" can be used
      # All defined metrics can be found in the 'metrics.xml'
      # There are basic metrics for raw HW counters and high-level metrics for derived counters
      <metric name=SQ:4,SQ_WAVES,VFetchInsts
      ></metric>

      # Filter by dispatches range, GPU index and kernel names
      <metric
        # range formats: "3:9", "3:", "3"
        range=""
        # list of gpu indexes "0,1,2,3"
        gpu_index=""
        # list of matched sub-strings "Simple1,Conv1,SimpleConvolution"
        kernel=""
      ></metric>

-o <output file> - output CSV file [<input file base>.csv]
  The output CSV file columns meaning in the columns order:
    Index - kernels dispatch order index
    KernelName - the dispatched kernel name
    gpu-id - GPU id the kernel was submitted to
    queue-id - the ROCm queue unique id the kernel was submitted to
    queue-index - The ROCm queue write index for the submitted AQL packet
    tid - system application thread id which submitted the kernel
    grd - the kernel's grid size
    wgr - the kernel's work group size
    lds - the kernel's LDS memory size
    scr - the kernel's scratch memory size
    vgpr - the kernel's VGPR size
    sgpr - the kernel's SGPR size
    fbar - the kernel's barriers limitation
    sig - the kernel's completion signal
    ... - The columns with the counters values per kernel dispatch
    DispatchNs/BeginNs/EndNs/CompleteNs - timestamp columns if time-stamping was enabled

-d <data directory> - directory where profiler store profiling data including thread treaces [/tmp]
    The data directory is renoving autonatically if the directory is matching the temporary one, which is the default.
-t <temporary directory> - to change the temporary directory [/tmp]
    By changing the temporary directory you can prevent removing the profiling data from /tmp or enable removing from not '/tmp' directory.

--basenames <on|off> - to turn on/off truncating of the kernel full function names till the base ones [off]
--timestamp <on|off> - to turn on/off the kernel dispatches timestamps, dispatch/begin/end/complete [off]
  Four kernel timestamps in nanoseconds are reported:
      DispatchNs - the time when the kernel AQL dispatch packet was written to the queue
      BeginNs - the kernel execution begin time
      EndNs - the kernel execution end time
      CompleteNs - the time when the completion signal of the AQL dispatch packet was received

--ctx-limit <max number> - maximum number of outstanding contexts [0 - unlimited]
--heartbeat <rate sec> - to print progress heartbeats [0 - disabled]

--stats - generating kernel executino stats, file <output name>.stats.csv
--hip-trace - to trace HIP, generates API execution stats/trace and JSON file viewable in chrome tracing
  'HCC_HOME' env var is required to be set to where 'hcc' is installed.
--hsa-trace - to trace HSA, generates API execution stats/trace and JSON file viewable in chrome tracing
  Generated files: <output name>.hsa_stats.txt <output name>.json
  Traced API list can be set by input .txt or .xml files.
  Input .txt:
    hsa: hsa_queue_create hsa_amd_memory_pool_allocate
  Input .xml:
    <trace name="HSA">
      <parameters api="hsa_queue_create, hsa_amd_memory_pool_allocate">
      </parameters>
    </trace>

Configuration file:
You can set your parameters defaults preferences in the configuration file 'rpl_rc.xml'. The search path sequence: .:/home/      evgeny:<package path>
First the configuration file is looking in the current directory, then in your home, and then in the package directory.
Configurable options: 'basenames', 'timestamp', 'ctx-limit', 'heartbeat'.
An example of 'rpl_rc.xml':
  <defaults
    basenames=off
    timestamp=off
    ctx-limit=0
    heartbeat=0
  ></defaults>
ROC Tracer
ROC-tracer library, Runtimes Generic Callback/Activity APIs. The goal of the implementation is to provide a generic independent from specific runtime profiler to trace API and asyncronous activity.
The API provides functionality for registering the runtimes API callbacks and asyncronous activity records pool support.
The library source tree:
inc/roctracer.h - Library public API
- src - Library sources
core - Library API sources
util - Library utils sources
- test - test suit
MatrixTranspose - test based on HIP MatrixTranspose sample
Documentation
- API declaration: inc/roctracer.h
- Code example: test/MatrixTranspose/MatrixTranspose.cpp
To build and run test
- ROCm-2.3 or higher is required

- Python2.7 is required.
  The required modules: CppHeaderParser, argparse.
  To install:
  sudo pip install CppHeaderParser argparse

- CLone development branches of roctracer:
  git clone -b amd-master https://github.com/ROCm-Developer-Tools/roctracer

- To customize environment, below are defaults:
 export HIP_PATH=/opt/rocm/HIP
 export HCC_HOME=/opt/rocm/hcc/
 export CMAKE_PREFIX_PATH=/opt/rocm

- Build ROCtracer
 export CMAKE_BUILD_TYPE=<debug|release> # release by default
 cd <your path>/roctracer && mkdir build && cd build && cmake -DCMAKE_INSTALL_PREFIX=/opt/rocm .. && make -j <nproc>

- To build and run test
 make mytest
 run.sh

- To install
 make install
 or
 make package && dpkg -i *.deb
ROCr Debug Agent
The ROCr Debug Agent is a library that can be loaded by ROCm Platform Runtime to provide the following functionality:
Print the state of wavefronts that report memory violation or upon executing a
s_trap 2instruction.Allows SIGINT (
ctrl c) or SIGTERM (kill -15) to print wavefront state of aborted GPU dispatches.It is enabled on Vega10 (since ROCm1.9), Vega20 (since ROCm2.0) GPUs.
Usage
To use the ROCr Debug Agent set the following environment variable:
export HSA_TOOLS_LIB=librocr_debug_agent64.so
This will use the ROCr Debug Agent library installed at /opt/rocm/lib/librocr_debug_agent64.so by default since the ROCm installation adds /opt/rocm/lib to the system library path. To use a different version set the LD_LIBRARY_PATH, for example:
export LD_LIBRARY_PATH=/path_to_directory_containing_librocr_debug_agent64.so
To display the machine code instructions of wavefronts, together with
the source text location, the ROCr Debug Agent uses the llvm-objdump
tool. Ensure that a version that supports AMD GCN GPUs is on your
$PATH. For example, for ROCm 2.10:
export PATH=/opt/rocm/opencl/bin/x86_64/:$PATH
Execute your application.
If the application encounters a GPU error it will display the wavefront
state of the GPU to stdout. Possible error states include:
The GPU executes a memory instruction that causes a memory violation. This is reported as an XNACK error state.
Queue error.
The GPU executes an
S_TRAPinstruction. The__builtin_trap()language builtin can be used to generate aS_TRAP.A SIGINT (
ctrl c) or SIGTERM (kill -15) signal is sent to the application while executing GPU code. Enabled by theROCM_DEBUG_ENABLE_LINUX_SIGNALSenvironment variable.
For example, a sample print out for GPU memory fault is:
Memory access fault by GPU agent: AMD gfx900
Node: 1
Address: 0x18DB4xxx (page not present;write access to a read-only page;)

64 wavefront(s) found in XNACK error state @PC: 0x0000001100E01310
printing the first one:

   EXEC: 0xFFFFFFFFFFFFFFFF
 STATUS: 0x00412460
TRAPSTS: 0x30000000
     M0: 0x00001010

     s0: 0x00C00000    s1: 0x80000010    s2: 0x10000000    s3: 0x00EA4FAC
     s4: 0x17D78400    s5: 0x00000000    s6: 0x01039000    s7: 0x00000000
     s8: 0x00000000    s9: 0x00000000   s10: 0x17D78400   s11: 0x04000000
    s12: 0x00000000   s13: 0x00000000   s14: 0x00000000   s15: 0x00000000
    s16: 0x0103C000   s17: 0x00000000   s18: 0x00000000   s19: 0x00000000
    s20: 0x01037060   s21: 0x00000000   s22: 0x00000000   s23: 0x00000011
    s24: 0x00004000   s25: 0x00010000   s26: 0x04C00000   s27: 0x00000010
    s28: 0xFFFFFFFF   s29: 0xFFFFFFFF   s30: 0x00000000   s31: 0x00000000

Lane 0x0
     v0: 0x00000003    v1: 0x18DB4400    v2: 0x18DB4400    v3: 0x00000000
     v4: 0x00000000    v5: 0x00000000    v6: 0x00700000    v7: 0x00800000
Lane 0x1
     v0: 0x00000004    v1: 0x18DB4400    v2: 0x18DB4400    v3: 0x00000000
     v4: 0x00000000    v5: 0x00000000    v6: 0x00700000    v7: 0x00800000
Lane 0x2
     v0: 0x00000005    v1: 0x18DB4400    v2: 0x18DB4400    v3: 0x00000000
     v4: 0x00000000    v5: 0x00000000    v6: 0x00700000    v7: 0x00800000
Lane 0x3
     v0: 0x00000006    v1: 0x18DB4400    v2: 0x18DB4400    v3: 0x00000000
     v4: 0x00000000    v5: 0x00000000    v6: 0x00700000    v7: 0x00800000

    .
    .
    .

Lane 0x3C
     v0: 0x0000001F    v1: 0x18DB4400    v2: 0x18DB4400    v3: 0x00000000
     v4: 0x00000000    v5: 0x00000000    v6: 0x00700000    v7: 0x00800000
Lane 0x3D
     v0: 0x00000020    v1: 0x18DB4400    v2: 0x18DB4400    v3: 0x00000000
     v4: 0x00000000    v5: 0x00000000    v6: 0x00700000    v7: 0x00800000
Lane 0x3E
     v0: 0x00000021    v1: 0x18DB4400    v2: 0x18DB4400    v3: 0x00000000
     v4: 0x00000000    v5: 0x00000000    v6: 0x00700000    v7: 0x00800000
Lane 0x3F
     v0: 0x00000022    v1: 0x18DB4400    v2: 0x18DB4400    v3: 0x00000000
     v4: 0x00000000    v5: 0x00000000    v6: 0x00700000    v7: 0x00800000

Faulty Code Object:

/tmp/ROCm_Tmp_PID_5764/ROCm_Code_Object_0:      file format ELF64-amdgpu-hsacobj

Disassembly of section .text:
the_kernel:
; /home/qingchuan/tests/faulty_test/vector_add_kernel.cl:12
; d[100000000] = ga[gid & 31];
        v_mov_b32_e32 v1, v2                                       // 0000000012F0: 7E020302
        v_mov_b32_e32 v4, v3                                       // 0000000012F4: 7E080303
        v_add_i32_e32 v1, vcc, s10, v1                             // 0000000012F8: 3202020A
        v_mov_b32_e32 v5, s22                                      // 0000000012FC: 7E0A0216
        v_addc_u32_e32 v4, vcc, v4, v5, vcc                        // 000000001300: 38080B04
        v_mov_b32_e32 v2, v1                                       // 000000001304: 7E040301
        v_mov_b32_e32 v3, v4                                       // 000000001308: 7E060304
        s_waitcnt lgkmcnt(0)                                       // 00000000130C: BF8CC07F
        flat_store_dword v[2:3], v0                                // 000000001310: DC700000 00000002
; /home/qingchuan/tests/faulty_test/vector_add_kernel.cl:13
; }
        s_endpgm                                                   // 000000001318: BF810000

Faulty PC offset: 1310

Aborted (core dumped)
Options
Dump Output
By default the wavefront dump is sent to stdout.
To save to a file use:
export ROCM_DEBUG_WAVE_STATE_DUMP=file
This will create a file called ROCm_Wave_State_Dump in code object
directory (see below).
To return to the default stdout use either of the following:
export ROCM_DEBUG_WAVE_STATE_DUMP=stdout
unset ROCM_DEBUG_WAVE_STATE_DUMP
Linux Signal Control
The following environment variable can be used to enable dumping
wavefront states when SIGINT (ctrl c) or SIGTERM (kill -15) is
sent to the application:
export ROCM_DEBUG_ENABLE_LINUX_SIGNALS=1
Either of the following will disable this behavior:
export ROCM_DEBUG_ENABLE_LINUX_SIGNALS=0
unset ROCM_DEBUG_ENABLE_LINUX_SIGNALS
Code Object Saving
When the ROCr Debug Agent is enabled, each GPU code object loaded by the
ROCm Platform Runtime will be saved in a file in the code object
directory. By default the code object directory is
/tmp/ROCm_Tmp_PID_XXXX/ where XXXX is the application process
ID. The code object directory can be specified using the following
environent variable:
export ROCM_DEBUG_SAVE_CODE_OBJECT=code_object_directory
This will use the path /code_object_directory.
Loaded code objects will be saved in files named ROCm_Code_Object_N
where N is a unique integer starting at 0 of the order in which the code
object was loaded.
If the default code object directory is used, then the saved code object file will be deleted when it is unloaded with the ROCm Platform Runtime, and the complete code object directory will be deleted when the application exits normally. If a code object directory path is specified then neither the saved code objects, nor the code object directory will be deleted.
To return to using the default code object directory use:
unset ROCM_DEBUG_SAVE_CODE_OBJECT
Logging
By default ROCr Debug Agent logging is disabled. It can be enabled to
display to stdout using:
export ROCM_DEBUG_ENABLE_AGENTLOG=stdout
Or to a file using:
export ROCM_DEBUG_ENABLE_AGENTLOG=<filename>
Which will write to the file <filename>_AgentLog_PID_XXXX.log.
To disable logging use:
unset ROCM_DEBUG_ENABLE_AGENTLOG
ROCm-GDB
This ROCm Debugger is a Deprecated project.
As of 2018, this is a deprecated software project. The ROCm software team is working on a new GDB-based debugger that works with the ROCr Debug Agent to support debugging GPU kernels.
The ROCm-GDB repository includes the source code for ROCm-GDB. ROCm-GDB is a modified version of GDB 7.11 revised to work with the ROCr Debug Agent to support debugging GPU kernels on Radeon Open Compute platforms (ROCm).
For more information refer here
ROCm Binary Utilities
Documentation need to be updated.
MIVisionX

MIVisionX toolkit is a set of comprehensive computer vision and machine intelligence libraries, utilities, and applications bundled into a single toolkit. AMD MIVisionX delivers highly optimized open source implementation of the Khronos OpenVX™ and OpenVX™ Extensions along with Convolution Neural Net Model Compiler & Optimizer supporting ONNX, and Khronos NNEF™ exchange formats. The toolkit allows for rapid prototyping and deployment of optimized workloads on a wide range of computer hardware, including small embedded x86 CPUs, APUs, discrete GPUs, and heterogeneous servers.
AMD OpenVX

AMD OpenVX [amd_openvx] is a highly optimized open source implementation of the Khronos OpenVX computer vision specification. It allows for rapid prototyping as well as fast execution on a wide range of computer hardware, including small embedded x86 CPUs and large workstation discrete GPUs.
AMD OpenVX Extensions
The OpenVX framework provides a mechanism to add new vision functions to OpenVX by 3rd party vendors. This project has below mentioned OpenVX modules and utilities to extend amd_openvx project, which contains the AMD OpenVX Core Engine.
amd_loomsl: AMD Radeon Loom stitching library for live 360 degree video applications.

amd_nn: OpenVX neural network module

amd_opencv: OpenVX module that implements a mechanism to access OpenCV functionality as OpenVX kernels
amd_winml: WinML extension will allow developers to import a pre-trained ONNX model into an OpenVX graph and add hundreds of different pre & post processing vision/generic/user-defined functions, available in OpenVX and OpenCV interop, to the input and output of the neural net model. This will allow developers to build an end to end application for inference.

Applications
MIVisionX has a number of applications built on top of OpenVX modules, it uses AMD optimized libraries to build applications which can be used to prototype or used as models to develop a product.
Cloud Inference Application: This sample application does inference using a client-server system.
Digit Test This sample application is used to recognize hand written digits.
MIVisionX OpenVX Classsification: This sample application shows how to run supported pre-trained caffe models with MIVisionX RunTime.
MIVisionX WinML Classification: This sample application shows how to run supported ONNX models with MIVisionX RunTime on Windows.
MIVisionX WinML YoloV2: This sample application shows how to run tiny yolov2(20 classes) with MIVisionX RunTime on Windows.
Neural Net Model Compiler And Optimizer

Neural Net Model Compiler & Optimizer model_compiler converts pre-trained neural net models to MIVisionX runtime code for optimized inference.
RALI
The Radeon Augmentation Library RALI is designed to efficiently decode and process images and videos from a variety of storage formats and modify them through a processing graph programmable by the user.
Samples
MIVisionX samples using OpenVX and OpenVX extension libraries
GDF - Graph Description Format
MIVisionX samples using runvx with GDF
skintonedetect.gdf
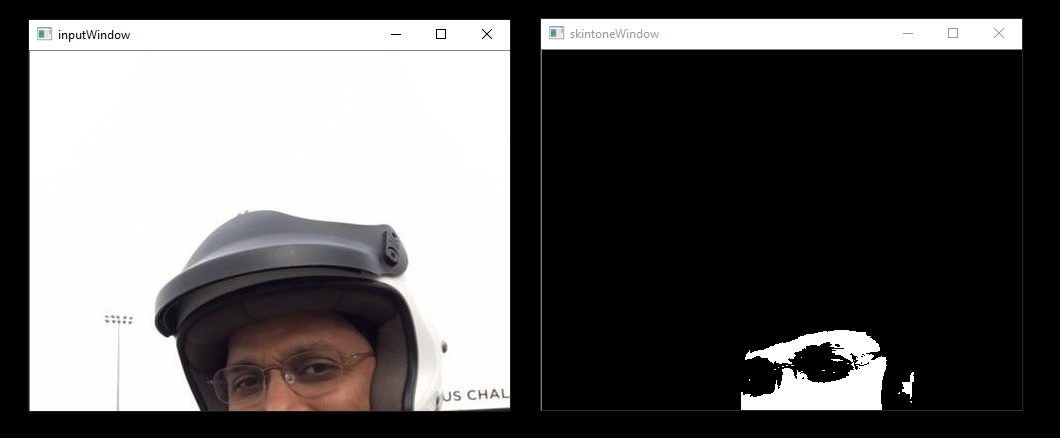
usage:
runvx skintonedetect.gdf
canny.gdf
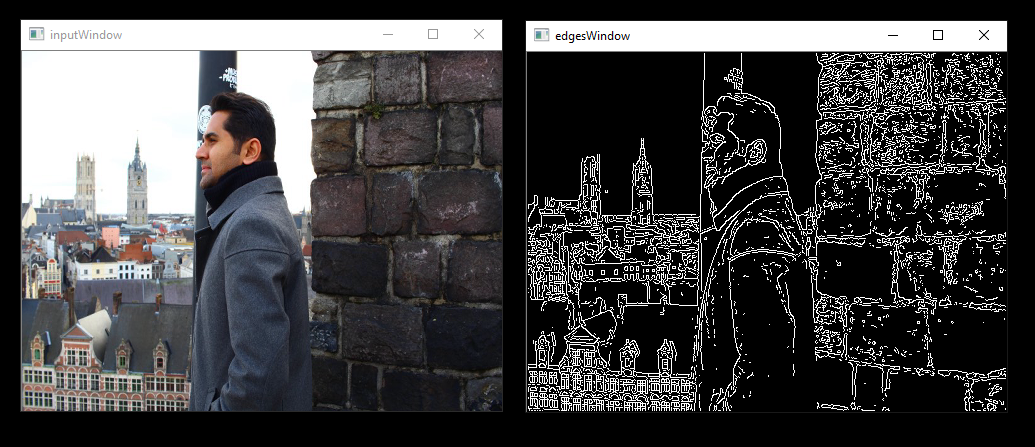
usage:
runvx canny.gdf
skintonedetect-LIVE.gdf
Using live camera
usage:
runvx -frames:live skintonedetect-LIVE.gdf
canny-LIVE.gdf
Using live camera
usage:
runvx -frames:live canny-LIVE.gdf
OpenCV_orb-LIVE.gdf
Using live camera
usage:
runvx -frames:live OpenCV_orb-LIVE.gdf
Note: More samples available on GitHub
Toolkit
MIVisionX Toolkit, is a comprehensive set of help tools for neural net creation, development, training, and deployment. The Toolkit provides you with helpful tools to design, develop, quantize, prune, retrain, and infer your neural network work in any framework. The Toolkit is designed to help you deploy your work to any AMD or 3rd party hardware, from embedded to servers.
MIVisionX provides you with tools for accomplishing your tasks throughout the whole neural net life-cycle, from creating a model to deploying them for your target platforms.
Utilities
inference_generator: generate inference library from pre-trained CAFFE models
loom_shell: an interpreter to prototype 360 degree video stitching applications using a script
RunVX: command-line utility to execute OpenVX graph described in GDF text file
RunCL: command-line utility to build, execute, and debug OpenCL programs
Prerequisites
CPU: SSE4.1 or above CPU, 64-bit
GPU: GFX7 or above [optional]
APU: Carrizo or above [optional]
Note: Some modules in MIVisionX can be built for CPU only. To take advantage of advanced features and modules we recommend using AMD GPUs or AMD APUs.
Windows
Windows 10
Windows SDK
Visual Studio 2017
Install the latest drivers and OpenCL SDK <https://github.com/GPUOpen-LibrariesAndSDKs/OCL-SDK/releases/tag/1.0>_
- OpenCV
Set OpenCV_DIR environment variable to OpenCV/build folder
Add %OpenCV_DIR%x64vc14bin or %OpenCV_DIR%x64vc15bin to your PATH
Linux
Install ROCm
ROCm CMake, MIOpenGEMM & MIOpen for Neural Net Extensions (vx_nn)
CMake 2.8 or newer download
Qt Creator for Cloud Inference Client
- Protobuf for inference generator & model compiler
install libprotobuf-dev and protobuf-compiler needed for vx_nn
- ` OpenCV <https://github.com/opencv/opencv/releases/tag/3.4.0>`_
Set OpenCV_DIR environment variable to OpenCV/build folder
- FFMPEG - Optional
FFMPEG is required for amd_media & mv_deploy modules
Pre-requisites setup script - MIVisionX-setup.py
For the convenience of the developer, we here provide the setup script which will install all the dependencies required by this project.
MIVisionX-setup.py- This scipts builds all the prerequisites required by MIVisionX. The setup script creates a deps folder and installs all the prerequisites, this script only needs to be executed once. If -d option for directory is not given the script will install deps folder in ‘~/’ directory by default, else in the user specified folder.
Prerequisites for running the scripts
ubuntu 16.04/18.04 or CentOS 7.5/7.6
usage:
python MIVisionX-setup.py --directory [setup directory - optional]
                          --installer [Package management tool - optional (default:apt-get) [options: Ubuntu:apt-get;CentOS:yum]]
                          --miopen    [MIOpen Version - optional (default:2.1.0)]
                          --miopengemm[MIOpenGEMM Version - optional (default:1.1.5)]
                          --ffmpeg    [FFMPEG Installation - optional (default:no) [options:Install ffmpeg - yes]]
                          --rpp       [RPP Installation - optional (default:yes) [options:yes/no]]
Note: use –installer yum for CentOS
Build & Install MIVisionX
Windows
Using .msi packages
MIVisionX-installer.msi: MIVisionX
MIVisionX_WinML-installer.msi: MIVisionX for WinML
Using Visual Studio 2017 on 64-bit Windows 10
Install OpenCL_SDK
Use MIVisionX.sln to build for x64 platform
NOTE: vx_nn is not supported on Windows in this release
Linux
Using apt-get/yum
Prerequisites
Ubuntu 16.04/18.04 or CentOS 7.5/7.6
Ubuntu
sudo apt-get install mivisionx
CentOS
sudo yum install mivisionx
Note:
vx_winml is not supported on linux
source code will not available with apt-get/yum install
executables placed in /opt/rocm/mivisionx/bin and libraries in /opt/rocm/mivisionx/lib
OpenVX and module header files into /opt/rocm/mivisionx/include
model compiler, toolkit, & samples placed in /opt/rocm/mivisionx
Package (.deb & .rpm) install requires OpenCV v3.4.0 to execute AMD OpenCV extensions
Using MIVisionX-setup.py and CMake on Linux (Ubuntu 16.04/18.04 or CentOS 7.5/7.6) with ROCm
Install ROCm
Use the below commands to setup and build MIVisionX
git clone https://github.com/GPUOpen-ProfessionalCompute-Libraries/MIVisionX.git
cd MIVisionX
python MIVisionX-setup.py --directory [setup directory - optional]
                          --installer [Package management tool - optional (default:apt-get) [options: Ubuntu:apt-get;CentOS:yum]]
                          --miopen    [MIOpen Version - optional (default:2.1.0)]
                          --miopengemm[MIOpenGEMM Version - optional (default:1.1.5)]
                          --ffmpeg    [FFMPEG Installation - optional (default:no) [options:Install ffmpeg - yes]]
                          --rpp       [RPP Installation - optional (default:yes) [options:yes/no]]
Note: Use –installer yum for CentOS
mkdir build
cd build
cmake ../
make -j8
sudo make install
Note:
vx_winml is not supported on Linux
the installer will copy all executables into /opt/rocm/mivisionx/bin and libraries into /opt/rocm/mivisionx/lib
the installer also copies all the OpenVX and module header files into /opt/rocm/mivisionx/include folder
Using CMake on Linux (Ubuntu 16.04 64-bit or CentOS 7.5 / 7.6 ) with ROCm
Install ROCm
- git clone, build and install other ROCm projects (using cmake and % make install) in the below order for vx_nn.
MIOpen – make sure to use -DMIOPEN_BACKEND=OpenCL option with cmake
install protobuf
install OpenCV
install FFMPEG n4.0.4 - Optional
- build and install (using cmake and % make install)
executables will be placed in bin folder
libraries will be placed in lib folder
the installer will copy all executables into /opt/rocm/mivisionx/bin and libraries into /opt/rocm/lib
the installer also copies all the OpenVX and module header files into /opt/rocm/mivisionx/include folder
add the installed library path to LD_LIBRARY_PATH environment variable (default /opt/rocm/mivisionx/lib)
add the installed executable path to PATH environment variable (default /opt/rocm/mivisionx/bin)
Verify the Installation
Linux
The installer will copy all executables into /opt/rocm/mivisionx/bin and libraries into /opt/rocm/mivisionx/lib
The installer also copies all the OpenVX and OpenVX module header files into /opt/rocm/mivisionx/include folder
Apps, Samples, Documents, Model Compiler and Toolkit are placed into /opt/rocm/mivisionx
Run samples to verify the installation
Canny Edge Detection
export PATH=$PATH:/opt/rocm/mivisionx/bin
export LD_LIBRARY_PATH=$LD_LIBRARY_PATH:/opt/rocm/mivisionx/lib
runvx /opt/rocm/mivisionx/samples/gdf/canny.gdf
Note: More samples are available here
Docker
MIVisionX provides developers with docker images for Ubuntu 16.04, Ubuntu 18.04, CentOS 7.5, & CentOS 7.6. Using docker images developers can quickly prototype and build applications without having to be locked into a single system setup or lose valuable time figuring out the dependencies of the underlying software.
MIVisionX Docker
Docker Workflow Sample on Ubuntu 16.04/18.04
Prerequisites
Ubuntu 16.04/18.04
Workflow
Step 1 - Install rocm-dkms
sudo apt update
sudo apt dist-upgrade
sudo apt install libnuma-dev
sudo reboot
wget -qO - http://repo.radeon.com/rocm/apt/debian/rocm.gpg.key | sudo apt-key add -
echo 'deb [arch=amd64] http://repo.radeon.com/rocm/apt/debian/ xenial main' | sudo tee /etc/apt/sources.list.d/rocm.list
sudo apt update
sudo apt install rocm-dkms
sudo reboot
Step 2 - Setup Docker
sudo apt-get install curl
sudo curl -fsSL https://download.docker.com/linux/ubuntu/gpg | sudo apt-key add -
sudo add-apt-repository "deb [arch=amd64] https://download.docker.com/linux/ubuntu $(lsb_release -cs) stable"
sudo apt-get update
apt-cache policy docker-ce
sudo apt-get install -y docker-ce
sudo systemctl status docker
Step 3 - Get Docker Image
sudo docker pull mivisionx/ubuntu-16.04
Step 4 - Run the docker image
sudo docker run -it --device=/dev/kfd --device=/dev/dri --cap-add=SYS_RAWIO --device=/dev/mem --group-add video --network host mivisionx/ ubuntu-16.04
- Optional: Map localhost directory on the docker image
option to map the localhost directory with trained caffe models to be accessed on the docker image.
usage: -v {LOCAL_HOST_DIRECTORY_PATH}:{DOCKER_DIRECTORY_PATH}
sudo docker run -it -v /home/:/root/hostDrive/ --device=/dev/kfd --device=/dev/dri --cap-add=SYS_RAWIO --device=/dev/mem --group-add video --network host mivisionx/ubuntu-16.04
Note: Display option with docker
Using host display
xhost +local:root
sudo docker run -it --device=/dev/kfd --device=/dev/dri --cap-add=SYS_RAWIO --device=/dev/mem --group-add video
--network host --env DISPLAY=unix$DISPLAY --privileged --volume $XAUTH:/root/.Xauthority
--volume /tmp/.X11-unix/:/tmp/.X11-unix mivisionx/ubuntu-16.04:latest
Test display with MIVisionX sample
export PATH=$PATH:/opt/rocm/mivisionx/bin
export LD_LIBRARY_PATH=$LD_LIBRARY_PATH:/opt/rocm/mivisionx/lib
runvx /opt/rocm/mivisionx/samples/gdf/canny.gdf
Release Notes
Known issues
Package (.deb & .rpm) install requires OpenCV v3.4.0 to execute AMD OpenCV extensions
Tested configurations
Windows 10
Linux: Ubuntu - 16.04/18.04 & CentOS - 7.5/7.6
ROCm: rocm-dkms - 2.9.6
rocm-cmake - github master:ac45c6e
MIOpenGEMM - 1.1.5
MIOpen - 2.1.0
Protobuf - V3.5.2
OpenCV - 3.4.0
Dependencies for all the above packages